
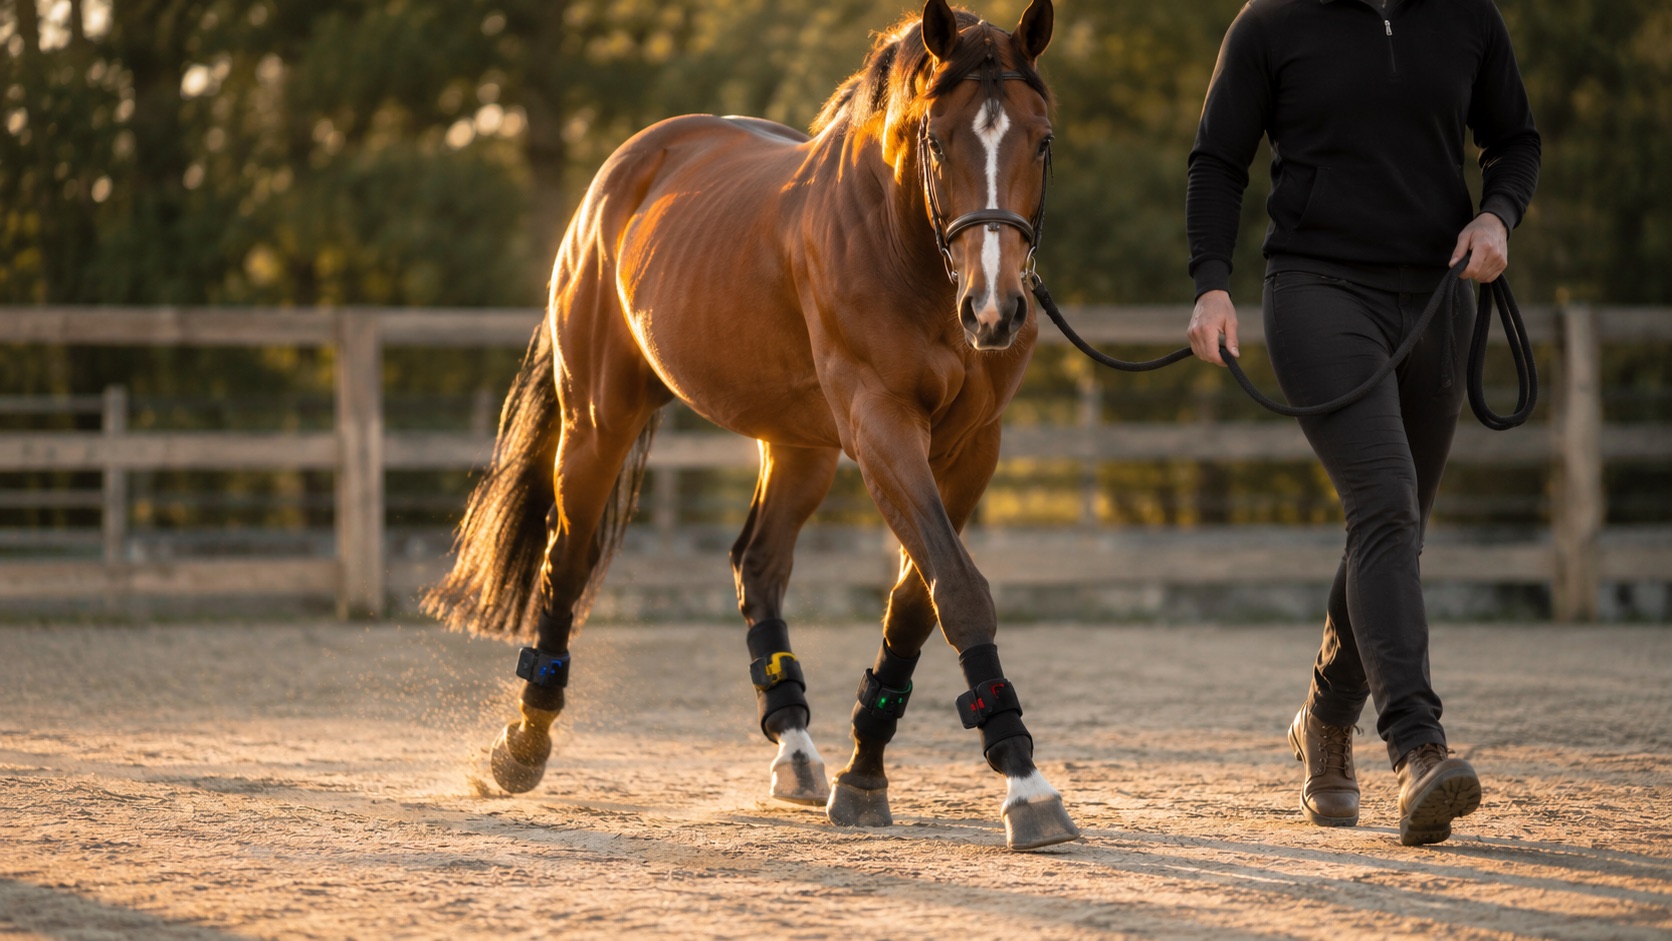
“He’s a grade two on the right fore.” Most owners have heard a vet say something like this, nodded, and not been entirely sure what it meant or how the number was reached. The number comes from the AAEP lameness scale, the most widely used way of grading lameness in horses. This is what each grade means, how a vet arrives at one by eye, how sensors put numbers on the same question, and what those numbers can and cannot tell you.
What the AAEP scale is
The American Association of Equine Practitioners (AAEP) scale grades lameness from 0 to 5. It is widely used internationally because it gives everyone the same shorthand: a farrier, a physio and a second-opinion vet all know roughly what “grade three” looks like. It is not the only scale; some vets, particularly in the UK and Europe, grade on a 0–10 scale instead, so it is worth asking which one your vet is using.
| Grade | What it means |
|---|---|
| 0 | Lameness not perceptible under any circumstances. |
| 1 | Difficult to observe and not consistently apparent, whatever the circumstances (ridden, circling, on a slope, on a hard surface). |
| 2 | Difficult to see at walk or trotting in a straight line, but consistently apparent in certain circumstances, such as under saddle, on a circle, on a slope or on a hard surface. |
| 3 | Consistently visible at trot under all circumstances. |
| 4 | Obvious at walk. |
| 5 | Minimal weight bearing in motion or at rest, or a complete inability to move. |
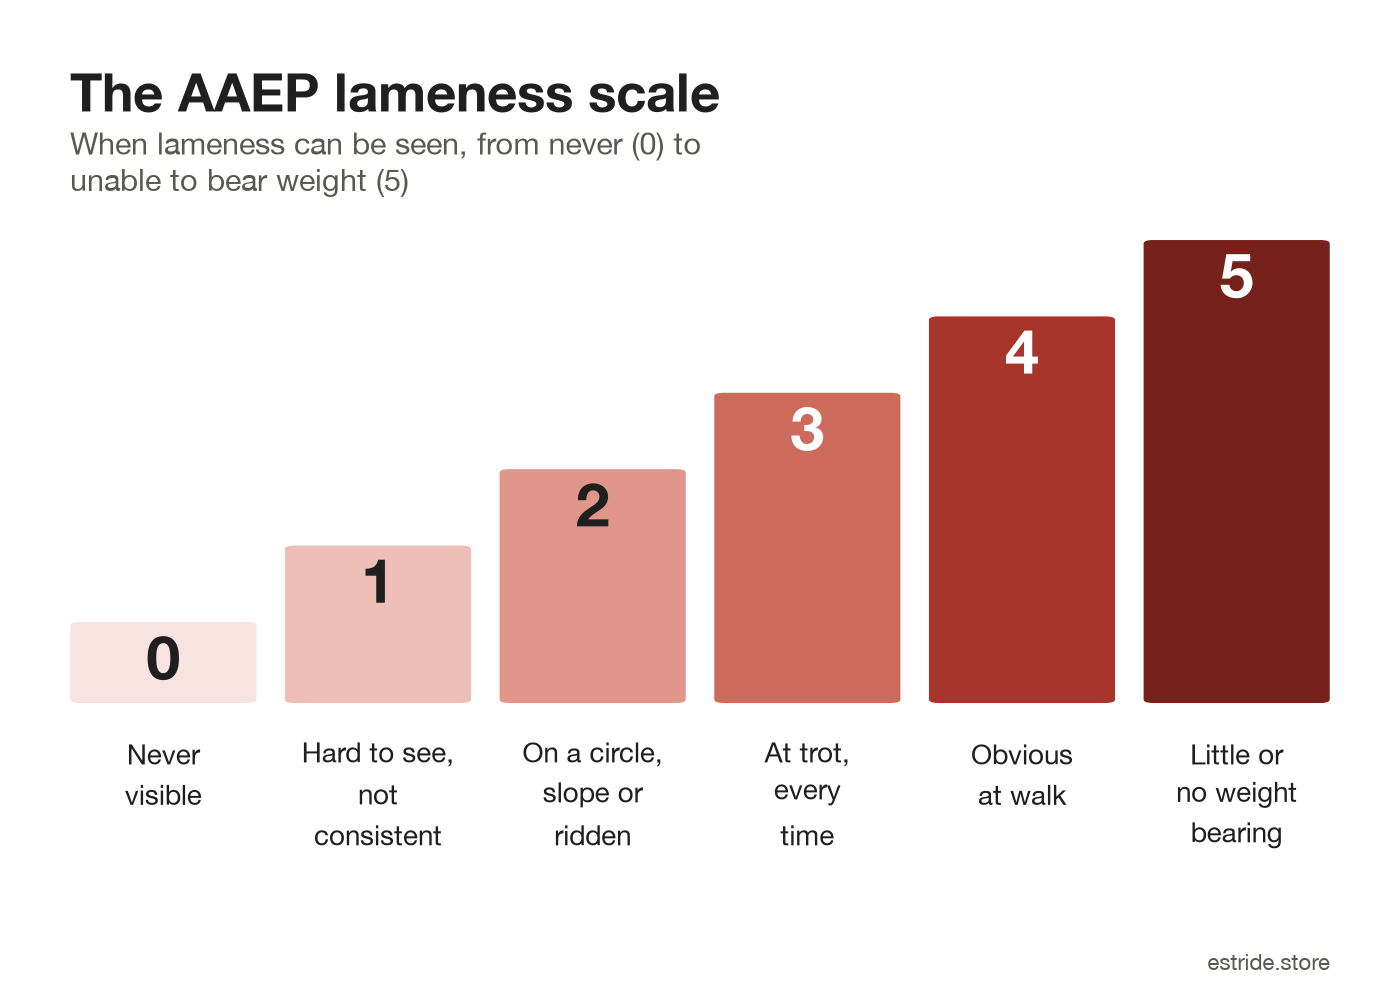
Two things are worth noticing. First, the scale describes when lameness can be seen, not how painful or how serious the cause is. A grade two can be the first sign of something that needs urgent attention. Second, the jump between grades is about consistency and gait: a grade three is visible at trot every time, a grade four is visible at walk.
How a vet scores lameness by eye
A lameness work-up usually starts with the horse trotted in hand on a firm, level surface, away from and back towards the vet, then often on a circle on both reins and on a softer surface. The vet is watching for asymmetry: the horse doing something different with one leg than with the other.
Front-leg lameness: the head nod
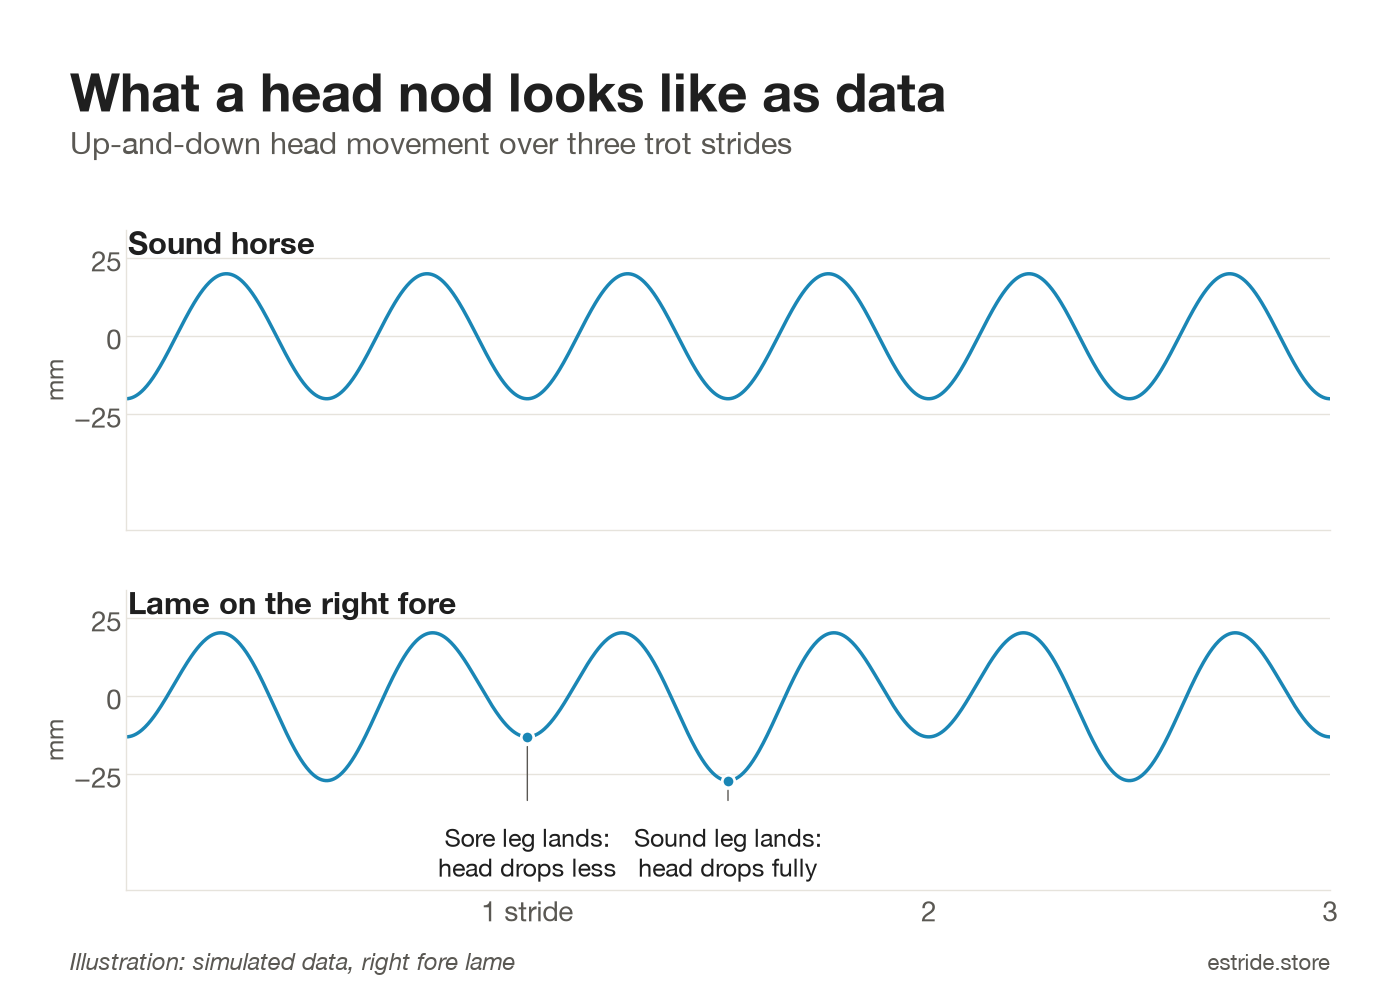
A horse lame in front lifts its head as the sore leg lands, to take weight off it, and drops it as the sound leg lands. Hence the saying “down on sound”. A clear nod at trot is one of the most recognisable signs of lameness.
Hind-leg lameness: the hip hike
Hind-limb lameness shows in the pelvis. As the lame hind leg takes weight, the pelvis drops less and then rises more on that side, the movement known as a “hip hike”. The Merck Veterinary Manual describes it as the most consistent sign of hind-limb lameness, but the pelvis moves less than the head, so it is harder to see. A hind-limb problem can also cause a head nod that looks like lameness in the front leg on the same side, which is one reason vets assess the whole horse.
Why the same horse can get different grades
Grading by eye is a skilled judgement, and the more obvious the lameness, the more closely vets agree. Mild lameness, the grade ones and twos, is harder: the asymmetry may be smaller than the eye can reliably separate from normal stride-to-stride variation, and it can change with the surface, the handler, the speed of the trot and the horse’s mood that day. A widely cited study of experienced vets watching the same horses (Keegan and colleagues, Equine Veterinary Journal, 2010) found only moderate agreement on which limbs were lame, and concluded that subjective evaluation is not very reliable for mild lameness. That is not a criticism of vets; it is the reason objective measurement has become part of modern lameness assessment.
The technical side: how sensors measure lameness
A sensor cannot see a horse the way a vet does. What it can do is measure the same movement many times, with the same method every time, and report how much the left side differs from the right.
What gets measured
- Head and pelvis movement. Clinical gait systems typically place inertial sensors on the poll and the pelvis and measure how far each moves up and down during each stride. The difference between left-stance and right-stance movement is the numeric version of the head nod and hip hike.
- Limb impact and loading. Force-plate studies, the laboratory gold standard, consistently show that a lame limb carries a lower peak vertical force than its partner, while the other legs take up the difference. Sensors on the legs look for the matching signal in the field: a consistent left–right difference in how hard each hoof lands.
- Stride timing. How long each stride takes, and whether diagonal pairs (left fore with right hind, right fore with left hind) stay in step at trot. A lame horse often changes the rhythm of its footfalls.
Turning stride data into a score
Every stride is slightly different, even in a sound horse. The useful question is not “was this stride uneven?” but “across many strides, is one side consistently different, and by how much?” That is a statistical question, and a few standard measures answer it:
- Symmetry index. The difference between the two sides as a percentage of their average. Zero is perfectly even.
- Effect size. How big the left–right difference is compared with the normal stride-to-stride spread. A small difference in a very consistent horse can matter more than a larger one in a horse whose strides vary a lot.
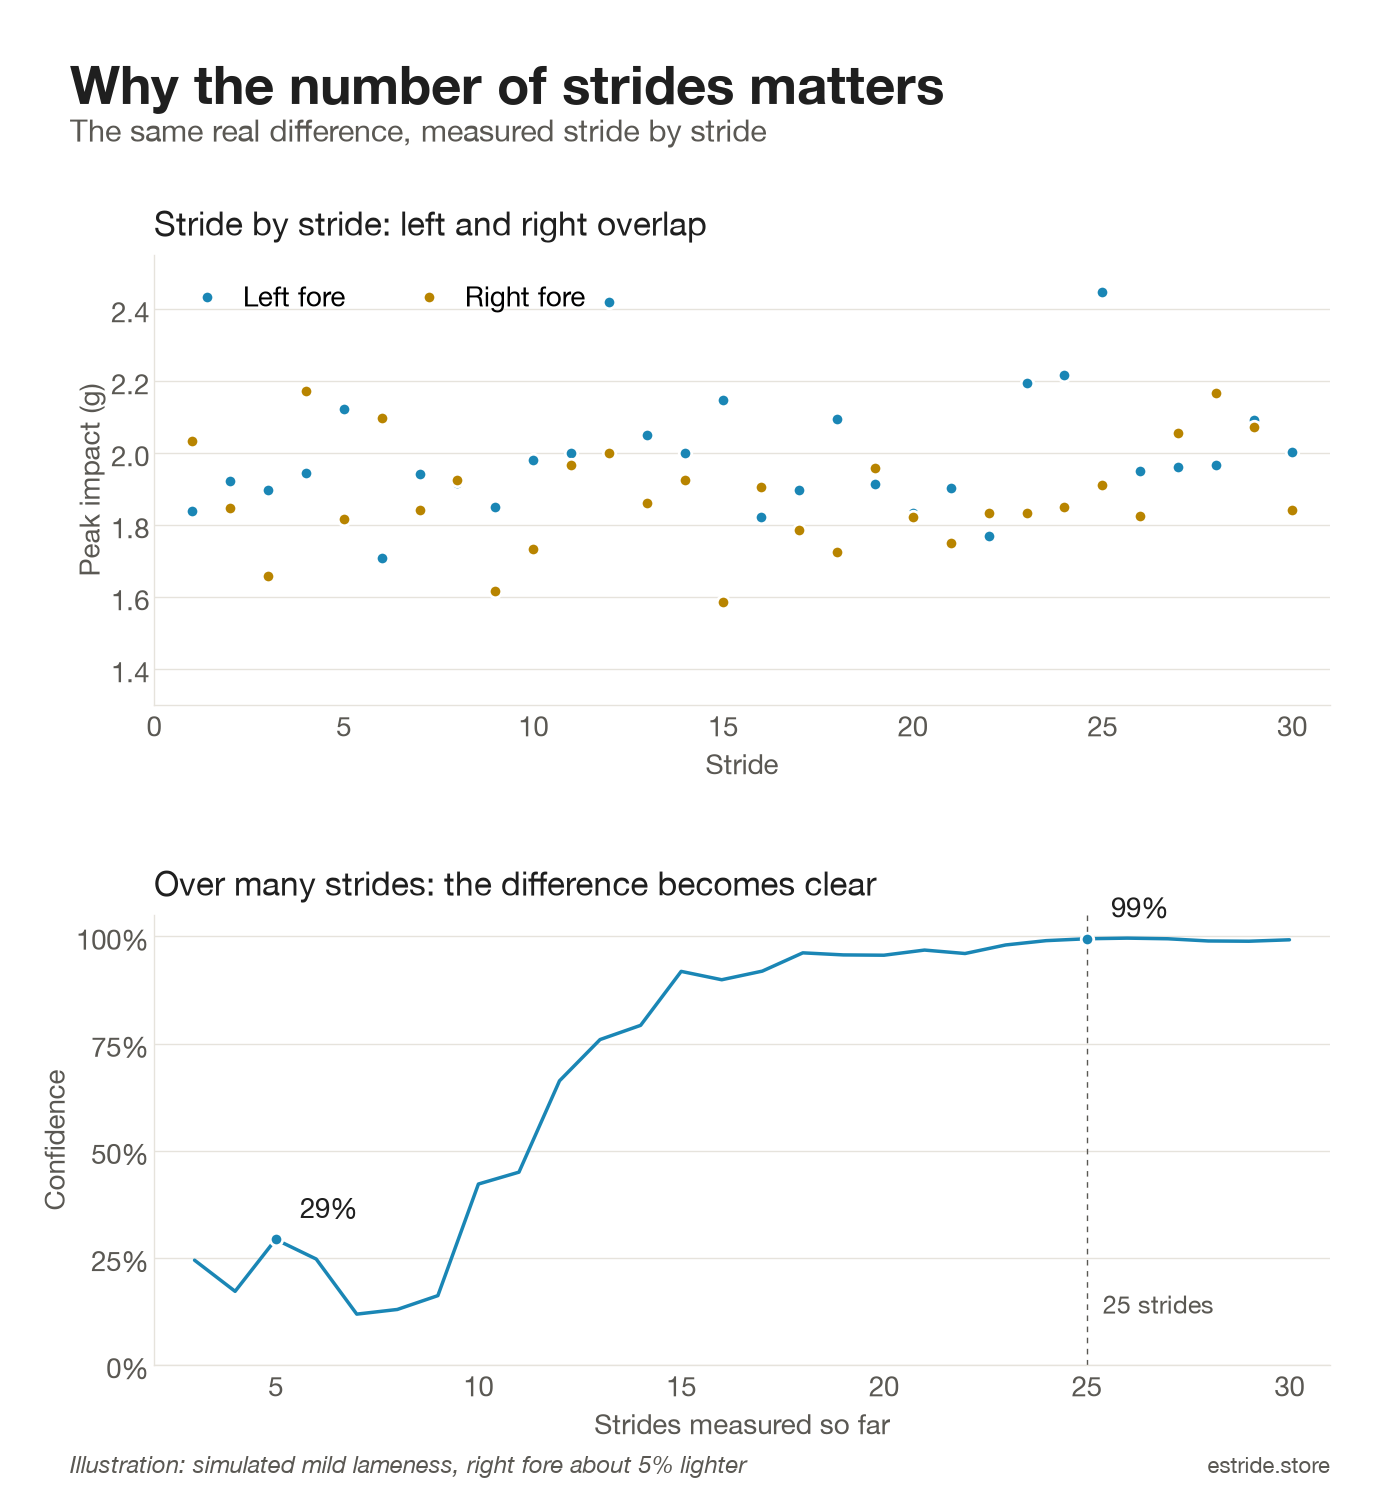
- Statistical confidence. How likely it is that the difference is real rather than chance. This is why stride count matters: a handful of strides can look uneven by accident, which is why research studies typically collect at least 25 strides per trot-up.
- Variability. A sore leg is often less consistent from stride to stride than a sound one, so a difference in variability between the two sides is a signal in itself.
How Estride Precision approaches it
Estride Precision Pro uses four small trackers, one on each leg, that send movement data to the Estride Connect app while the horse works. For every leg it detects each footfall and records how hard the hoof landed, then compares the two front legs with each other and the two hind legs with each other.
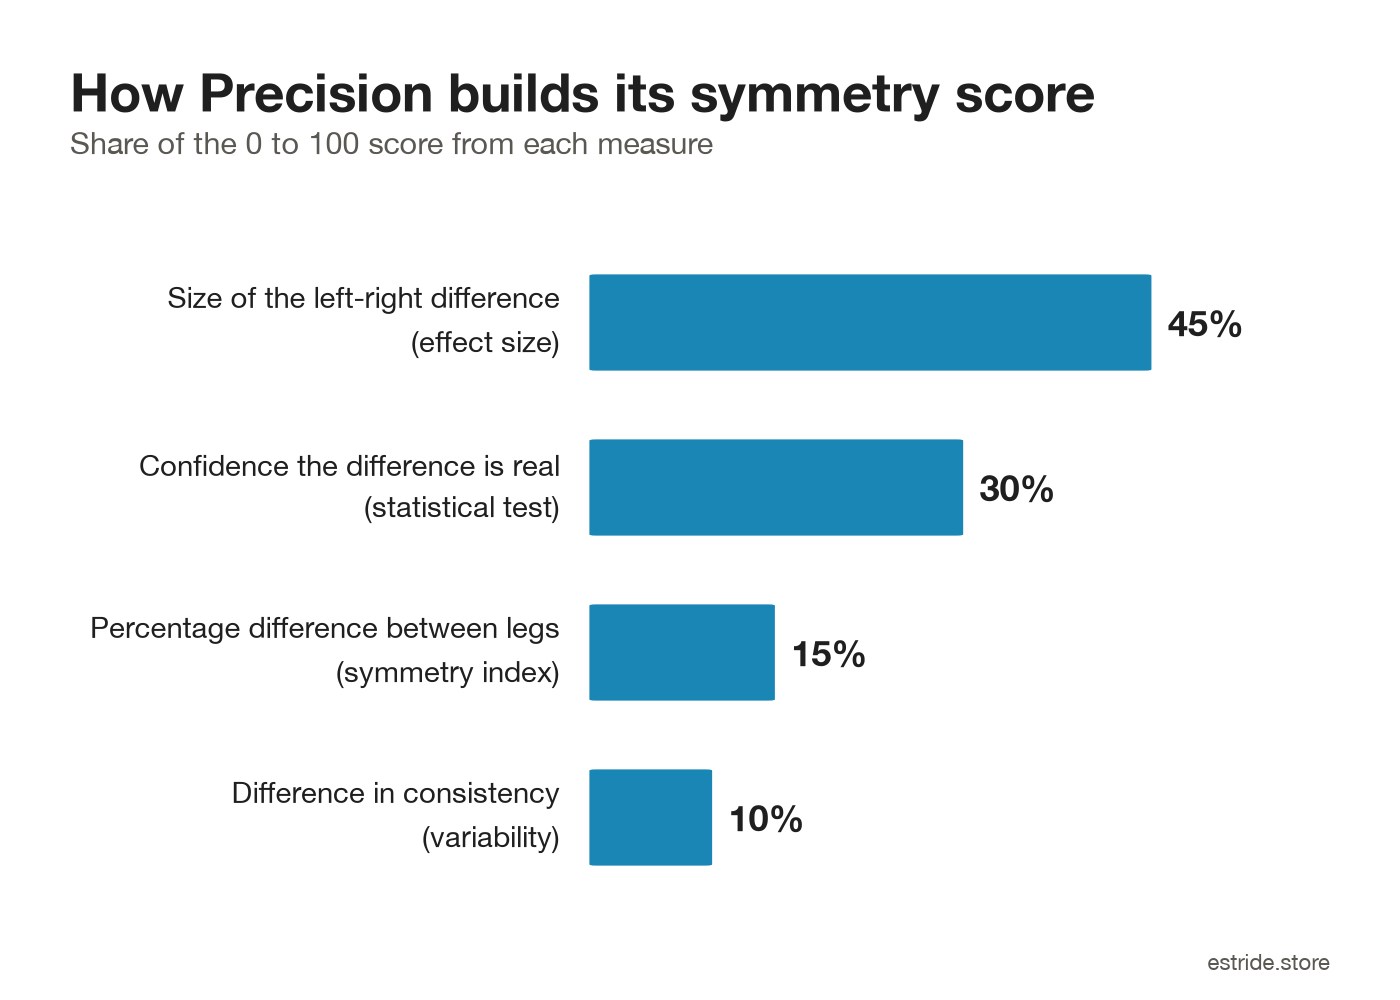
For each pair it combines the four measures above into a single symmetry score from 0 to 100:
- the size of the left–right difference (effect size) carries the most weight, about 45%;
- the statistical confidence that the difference is real, about 30%;
- the symmetry index, about 15%;
- the difference in variability between the two legs, about 10%.
The worse of the two pairs sets the overall score, so a clear front-leg issue is not averaged away by sound hind legs. The app shows how many strides went into the result and a confidence figure, so you can tell a well-founded reading from an early one. Where one leg is consistently landing more lightly than its partner, the app points to it as the leg to look at.
To make the number easier to relate to, the app places it on the same 0–5 scale used by vets, and follows the scale’s own logic: it will not suggest a grade two or three unless the horse has been trotting, because that is the gait the AAEP grades are defined at. Treat that grade as a guide to how asymmetric the movement was, not as a diagnosis. Only a vet can grade lameness clinically and find its cause.
Where the numbers help most
The real strength of measuring rather than watching is comparison over time. A single reading tells you how even the horse moved on one day, on one surface. A series of readings tells you whether things are changing:
- Catching changes early. A score that creeps up over a few weeks is worth a conversation with your vet, even if you cannot see anything yet.
- Tracking rehabilitation. After an injury, regular sessions show whether the horse is evening up as work increases, and give your vet objective data to plan the next stage.
- Checking the effect of a change. New shoes, a saddle refit or a change of surface can all be compared against the horse’s own baseline.
How to record a useful session
The more consistent the conditions, the more meaningful the comparison. These habits make the biggest difference:
- Record a baseline while the horse is sound, so later sessions have something to be compared with.
- Use a firm, level surface and the same one each time where you can.
- Include steady trot work. Aim for at least 25 strides of straight-line trot; lameness is assessed at trot for good reason.
- Work on both reins if you add circles, and keep the speed steady rather than rushing or dawdling.
- Fit the trackers the same way each session, in the same position on each leg.
- Compare like with like: a session on a soft surface after a day off is not directly comparable with one on a hard surface after a busy week.
Start without any sensors: the free Estride Care Kit
You do not need sensors to start keeping a better record of your horse’s soundness. The Estride Care Kit is a set of free tools in the Estride Connect app, with no sensor, subscription or payment needed. Three of them fit naturally alongside everything above:
- Lameness scanner. Film a 10–15 second trot-up, straight away from the camera and back, and score each leg on the AAEP 0–5 scale with prompts for what to look for: the head nod in front, the hip hike behind. Each assessment is saved, with the clip, to a dated soundness diary your vet can review.
- Equine vitals. Tap-to-count heart rate and breathing, plus capillary refill and gum colour, so you know your horse’s normal and can spot when something is off.
- Hoof photo diary. Dated photos of each hoof, useful for showing your farrier or vet how things have changed.
Filming the days a horse shows a lameness is particularly valuable for intermittent problems: the vet sees the lameness, rather than a sound horse on the day of the visit. Get Estride Connect on the App Store or Google Play, and see every tool on the Care Kit page. When you want measured numbers on top of your own observations, Precision Pro adds the sensor side in the same app.
When to call the vet
No score replaces professional judgement. Call your vet if your horse is lame at walk, reluctant to bear weight, has heat or swelling in a leg or hoof, or if a lameness lasts more than a day or two. Mention any sensor readings and trends you have: objective data alongside the vet’s own examination is exactly where it is most valuable.
In short
The AAEP scale describes when lameness can be seen, from never (0) to unable to bear weight (5). Vets grade it by watching for asymmetry, mainly the head nod in front and the hip hike behind. Sensors measure the same asymmetry over many strides and use statistics to separate a real difference from normal variation. Used regularly and in consistent conditions, that measurement is a powerful way to spot change early and follow recovery, and a useful companion to, never a substitute for, your vet.
Further reading
- American Association of Equine Practitioners: Client education: lameness exams
- Merck Veterinary Manual: The lameness examination in horses
- Keegan KG et al. (2010). Repeatability of subjective evaluation of lameness in horses. Equine Veterinary Journal 42(2): 92–97.
This article is for general information and is not veterinary advice. If you are worried about your horse, contact your vet.

Leave A Comment